2.4: A Visualization Primer
Why Does Data Visualization Matter?
Small Groups
As a group, take 5 minutes to compare your notes and come to a group consensus on your top 3 reasons. Be sure to choose someone to report out!
Types of Visualization
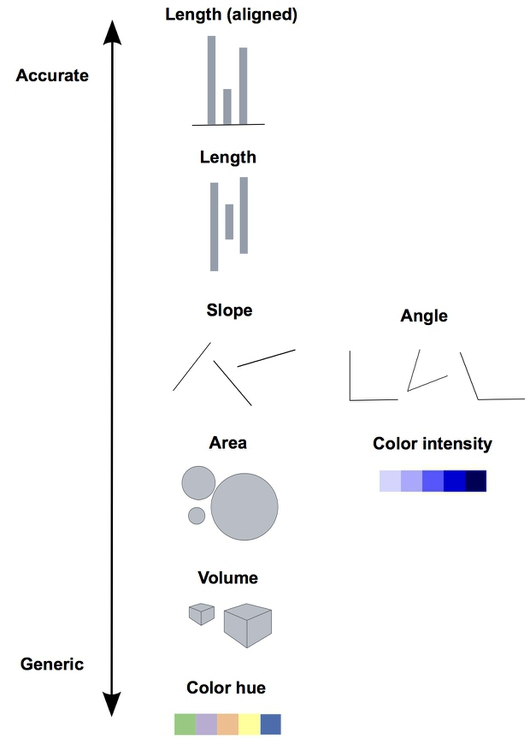
Visual cues for communicating data
Here is a decent overview of some of the core concepts of data visualization.
This website is pretty great and goes into a lot of detail about good practices in data visualization. If this is something that really piques your interest, I encourage you to check it out!
In this course, our main take-away from this website is the use of visual cues to communicate data and which ones are better than others.
Small group activity
In groups, discuss as many all types of visualization that come to mind. It’s okay if you don’t know what they are called! Make a quick list or draw them out if you prefer.
Types of data visualizations:
This website is an amazing reference for data visualization methods and when to use what. It also has examples of each type plotted in ggplot2.
We will talk more about how to choose the right visualization for your data now and also in the rest of the module.
Data matching activity
Still in your groups, open the PDF called “data_viz_matching”
Spend a few minutes seeing if you can match the data descriptions to the types of data visualizations.
Each “dataset” is pulled from the same overall dataset: measurements from 344 individual penguins from different species and on different islands over 3 years. Some datasets created multiple plots.
- Penguin body mass and flipper lengths
- Penguin flipper lengths
- Penguin species and flipper lengths
- Penguins body mass, species, and flipper lengths
Matches
See the PowerPoint on D2L for full details!
Figure Critique
First, read through this blog post on the “Dos and Don’ts of Data Visualization”
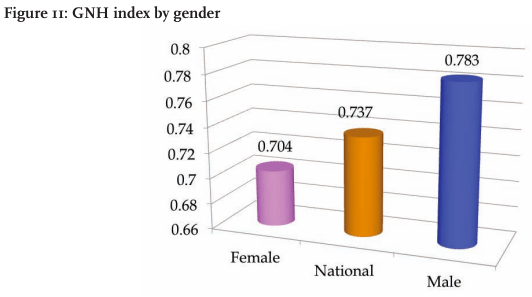
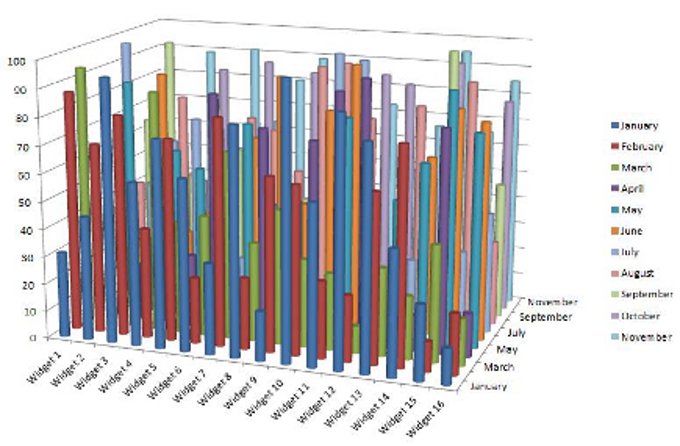
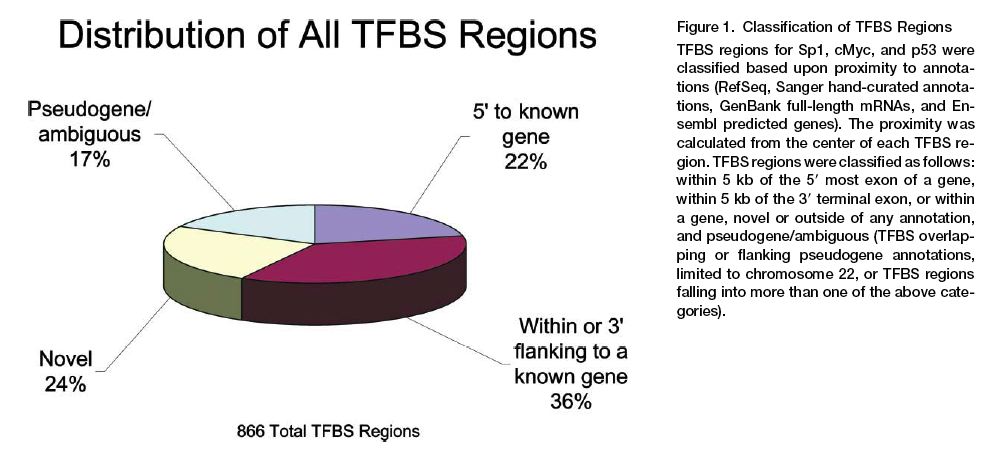
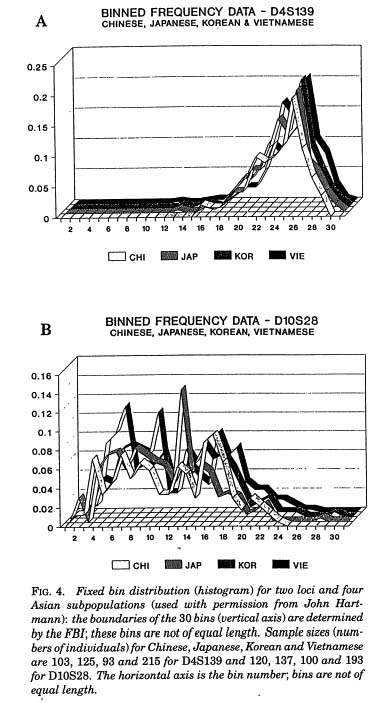
Now that you have some insights, let’s critique these figures below. Yes, these are actual figures in the wild…
- What aspects don’t work?
- What aspects do work?
- How would you present the data?
Figures: